


Ceyda Okudu 1,2, Mehmet Özaslan 2, Işık Didem Karagöz 2, İbrahim Halil Kılıç 2, Sakıp Erturhan 3, Filiz Gerçeker 2, İlyas Başkonuş 4
1 Department of Nutrition and Dietetics, Halic University, Istanbul, Türkiye
2 Department of Biology, Gaziantep University, Gaziantep, Türkiye
3 Department of Urology, Gaziantep University, Gaziantep, Türkiye
4 Department of General Surgery, Gaziantep University, Gaziantep, Türkiye
Received: 8 February 2024
Accepted: 11 February 2024
Published: 11 February 2024
Corresponding author:
Mehmet Özaslan,
Department of Biology, Gaziantep University, Faculty of Science and Letters, Gaziantep, Türkiye.
ozaslanmd@gantep.edu.tr
doi: 10.5281/zenodo.12528749
ABSTRACT
One of the most prevalent solid epithelial malignancies and the third most common cancer among men in Turkey is bladder cancer. Its development characteristics and histology are varied. Bladder tumor formation involves numerous pathways and multi-step genetic changes. A significant amount of heterozygosity, including loss of heterozygosity (LOH) and chromosome deletions, has been observed in bladder tumors’ molecular pathogenesis. The purpose of the current study is to determine the 20q11–13 loss of heterozygosity and compare it to the tumor grades and stages. 9 polymorphic microsatellite markers in 33 matched bladder normal and tumor tissues were used to identify the loss of heterozygosity of 20q11-13. LOH in 17 of 33 patients (51,5%) at least in one locus was determined. The highest frequency of LOH was found on D20S872 (30%) loci which have been near substantial genes for tumor progression such as BCL2L1 and KIF3B. The lowest frequency of LOH was on D20S465 (5%) loci and LOH on D20S443 loci was not detected. No statistically significant association between tumor grades and stages and LOH frequency (p>0,05) also were found. We recommend further molecular analyses with larger patient groups to detect candidate tumor suppressor genes in this region. Moreover, for the identification of new candidate tumor suppressor genes for bladder cancer, further genome-wide LOH scanning may provide much more genetic information.
Keywords
Bladder cancer, chromosome 20, loss of heterozygosity.
INTRODUCTION
Multiple molecular changes brought on by environmental risk factors or emerging spontaneously play a significant part in the development of bladder tumors. One of the most prevalent molecular changes in bladder cancer that contributes to the inactivation of tumor suppressor genes is the loss of heterozygosity (LOH). LOH, defined as allelic losses on a chromosomal region, is a key for detecting inactive tumor suppressor genes (1). The loss of both copies of a tumor suppressor gene results in the loss of normal cellular function and the onset of carcinogenesis, according to Knudson’s two-hit model (2). LOH on a specific locus occurs when a deletion or chromosomal loss has occurred (3).
Bladder cancer is one of the most common solid epithelial cancers and its rate has been 2.8% among deaths due to cancer all around the world (4). It is one of the most common types of occupational cancers such as lung cancer and mesothelioma (5). It has heterogeneous histopathology and growth properties. The majority of bladder tumors are transitional cell carcinoma (TCC), approximately 90% and the other groups include squamous cell carcinoma and adenocarcinoma (6). Molecular analysis of bladder cancers has shown considerable heterogeneity, including loss of heterozygosity (LOH) and deletions in many chromosomes. Particularly, LOH on 9p and 9q chromosomal regions is the most frequent genetic alteration in bladder cancer (7) and also it has been reported that LOH on 5p, 10q, 18q, 17p, 13q, 15q, 16q, 1p, 8p, 10p, 3p chromosomal regions as well as chromosome 9 at bladder cancer (8-13, 6). In another study, it was demonstrated that LOH on 18q21-23 has been in muscle-invasive bladder cancer patients and has related to clinical outcomes of patients (14). In urothelial carcinoma, LOH at 17p13.1 was found in all stages and grades at various rates, according to Beothe et al.s’ (15) research. Abdel Rahman et al. (16) conducted a pilot study in Egyptian bladder cancer patients and found LOH on chromosomes 16 and 4.
Table 1. Properties of microsatellite markers in chromosome 20q11-13 used for LOH analysis.
| Microsatellite marker | Chromosomal region | Sequences | Size (bp) |
| D20S118 | 20q11.1 | 5’-AGCTATATTTGTCAATGTGAGTTGT-3’ 5’-GTCCGTGATAGAGCAGAGTG- 3’ | 169-179 |
| D20S872 | 20q11.21 | 5’-GGTTCCCAAACAACATCCTG- 3’ 5’-AGGACTCTTCCAAAAGTGGCT- 3’ | 180-218 |
| D20S174 | 20q11.22 | 5’-GGCTGATTTCTATAACACAGCACAA- 3’ 5’-TCATACAGACCTACTGGGGCAC- 3’ | 277-305 |
| D20S465 | 20q11.23 | 5’-GACAAATTTCTGGGCTGGC- 3’ 5’-AAAATGTCCAGGCAACAGAG- 3’ | 219 |
| D20S481 | 20q12 | 5’-TGGGTTATGAGTGCACACAG- 3’ 5’-AACAGAAAAAGACACACAGC- 3’ | 217-253 |
| D20S891 | 20q13.13 | 5’-GCAAGCATCTACAAGGCTCTTCAT- 3’ 5’-CTACAGGTGAGCGCCACCAT- 3’ | 190-216 |
| D20S468 | 20q13.2 | 5’-GGATATTGGGGCCACTGC- 3’ 5’-TACCTAGTGACCAAAGGTTTCC- 3’ | 194-212 |
| D20S171 | 20q13.33 | 5’-TATAGGTGAGGACCCTGAGG- 3’ 5’-ACACCAAGCCATGTAACCTG- 3’ | 123-149 |
| D20S443 | 20q13.3 | 5’-GAACCAAGGAAGTTGTTCAAC- 3’ 5’-TTGCTCCAACCAGGAGGCA- 3’ | 140 |
LOH on chromosome 20 has been analyzed for retinoblastoma, colorectal, gastric, small cell lung, and lobular breast cancers, especially myeloid and lymphocytic leukemias (17-23). Related studies about bladder cancer and chromosome 20 have been also reported and the relationship between bladder cancer and CDC91L1 oncogene has been demonstrated (24). Thus Higashi et al. (7) detected allelic imbalance on 20p and 20q chromosomal regions with a rate of 57.1% at transitional cell carcinomas in the urinary tract.
The present study has aimed to identify the loss of heterozygosity of 20q11-13 using 9 polymorphic microsatellite markers. Besides, we tried to compare detected LOH on each locus with the tumor grades and stages.
METHODS
Tissue Samples and DNA Extraction
Tumor tissues and tumor-adjacent normal tissues were collected from 33 bladder cancer patients during transurethral resection at the Department of Urology, Gaziantep University Hospital. The fresh tissues were transferred to the laboratory with liquid nitrogen and were stored at -80 0C until the extraction of DNA. The ethical certificate was received from the ethics committee for clinical research of Gaziantep University (Ethical number is 10-2011/174) before starting this study. At the same time, demographic and clinical information of patients were obtained. DNA was extracted from all tumor and normal tissues using QIAamp DNA Mini Kit (Qiagen, Germany) followed by homogenized in 1xPBS. After DNA isolation, concentrations of DNA were determined with a spectrophotometer (Thermo Scientific, USA).
PCR Amplification
The base pairs, sequences, and localization on chromosome 20 of microsatellite markers D20S118, D20S872, D20S174, D20S465, D20S481, D20S891, D20S468, D20S171, and D20S443 were available from the web site of NCBI database (www.ncbi.nlm.nih.gov) and were shown in Table 1.
PCR amplification was performed in a total reaction volume of 25 µl. 60 ng of genomic DNA were subjected to PCR, performed in a final volume of 25 µl containing 0.2 mM of each dNTP, 1 µM each primer, 25 mM MgCl2, 0.5 U Taq polymerase, and 1X PCR buffer (New England Biolabs, UK). 1 µl formamide was added per tubes as an enhancer for reaction. Thirty- five cycles of denaturation at 94 0C for 45 seconds, annealing between 55-70 0C for 45 seconds, and extension at 72 0C for 45 seconds were performed with a thermal cycler (Takara, Japan). The annealing temperature was changed depending on base pairs of primers between 55-70 0C. After PCR amplification, all PCR products were analyzed with 1.5% agarose gel electrophoresis. An updated idiogram of the 20q11-13 region was obtained from http://www.ncbi.nlm.nih.gov/genome to illustrate the localization of markers and the distance between markers (Figure 1).
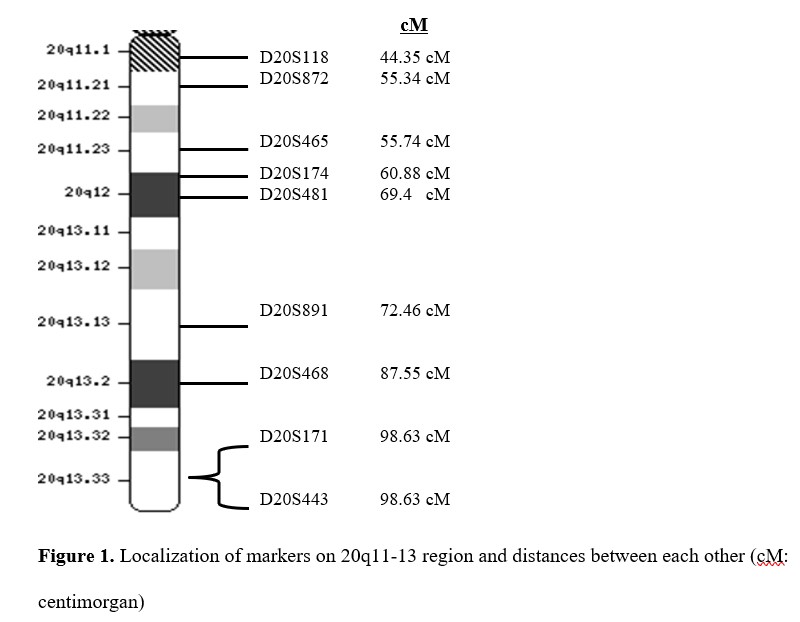
Figure 1. Localization of markers on 20q11-13 region and distances between each other.
PAGE and Silver Nitrate Staining
PCR products were denatured at 95 0C for 5 minutes with 7 µl loading buffer containing 0.01% bromophenol blue, 0.01% xylene cyanol FF, 20 mM EDTA and 80% formamide. Denatured PCR products were directly chilled on ice and were separated in 7% polyacrylamide – 8 M urea formamide gel using Sequi-Gen GT Electrophoresis System (BioRad, Germany). The electrophoresis was performed at 60 W for 1 hour and 30 minutes at 50 0C. The gel was stained with silver nitrate solution at the end of the electrophoresis. The method which was reported by Benbouza et al. (25) previously was used and LOH was determined by comparing tumor and normal DNA and was displayed with a digital camera (Sony, Japan).
Statistical Analysis
GraphPad Instat (version 3.05) was used to conduct the statistical analysis. Results were represented as standard deviation or percent. p<0,05 was accepted as statistically significance. Comparisons between LOH and tumor stages and grades were performed by Fisher’s exact test.
RESULTS
Characteristics of Patients and Tumor Samples
33 bladder cancer patients have been included in this study. One of those patients (3.03%) was female and the other 32 patients (96.97%) were males (Table 2). The ages of patients are the most frequently between 65 and 74 (42.42%) and their average age was 64.46±1.88. All patients smoked except from female patient. Tumor tissues that were taken from patients were classified according to TNM stages and grades. The most frequency was observed in T2 stage (42.42%) and G3 grade (69.70%). 30 of 33 (90.9%) bladder tumor tissues were transitional cell carcinoma (TCC) and 3 of 33 (9.1%) tissues were adenocarcinoma (Table 3).
Table 2. Characteristics of patients with bladder cancer.
| Tumor tissue | Sex | Age | Stage | Grade | Tumor type |
| T1 | M | 71 | T2 | G3 | TCC |
| T2 | M | 81 | T2 | G3 | TCC |
| T3 | M | 74 | Ta | G2 | TCC |
| T4 | M | 65 | Ta | G2 | TCC |
| T5 | M | 72 | T2 | G3 | TCC |
| T6 | M | 72 | T2 | G3 | TCC |
| T7 | M | 66 | T1 | G3 | TCC |
| T8 | M | 76 | T2 | G3 | TCC |
| T9 | M | 53 | Ta | G3 | TCC |
| T10 | M | 58 | Ta | G1 | TCC |
| T11 | M | 57 | Ta | G1 | Adenocarcinoma |
| T12 | M | 66 | Ta | G2 | TCC |
| T13 | M | 79 | Ta | G2 | TCC |
| T14 | M | 68 | Ta | G2 | TCC |
| T15 | M | 68 | T2 | G3 | TCC |
| T16 | M | 62 | T1 | G3 | TCC |
| T17 | M | 70 | T2 | G3 | Adenocarcinoma |
| T18 | M | 73 | T2 | G3 | TCC |
| T19 | M | 75 | Ta | G3 | TCC |
| T20 | M | 52 | T2 | G3 | TCC |
| T21 | M | 73 | T2 | G3 | TCC |
| T22 | M | 62 | T2 | G3 | TCC |
| T23 | M | 50 | Ta | G3 | TCC |
| T24 | M | 65 | T1 | G3 | TCC |
| T25 | M | 68 | Ta | G2 | TCC |
| T26 | M | 60 | T3 | G3 | TCC |
| T27 | M | 79 | T0 | G2 | Adenocarcinoma |
| T28 | M | 64 | T2 | G3 | TCC |
| T29 | M | 34 | Ta | G3 | TCC |
| T30 | M | 72 | T2 | G3 | TCC |
| T31 | M | 63 | T2 | G3 | TCC |
| T32 | M | 44 | T1 | G3 | TCC |
| T33 | F | 35 | Ta | G2 | TCC |
TCC: Transitional cell carcinoma, M: Male, F: Female.
Table 3. Clinicopathologic features of tumor samples.
| Characteristics | n (%) |
| Number of patients | 33 |
| Mean age ± Standard deviation | 64.46±1.88 |
| Gender | |
| Male | 32 (96.97) |
| Female | 1 (3.03) |
| Clinicopathologic Features | n (%) |
| Tumor Type | |
| TCC | 30 (90.9) |
| Adenocarcinoma | 3 (9.1) |
| Stage | |
| T0 | 1 (3.03) |
| Ta | 13 (39.40) |
| T1 | 4 (12.12) |
| T2 | 14 (42.42 |
| T3 | 1 (3.03) |
| Grade | |
| G1 | 2 (6.06) |
| G2 | 8 (24.24) |
| G3 | 23 (69.70) |
TCC: Transitional cell carcinoma.
Chromosome 20q11–13 LOH Analysis for Nine Microsatellite Markers
33 bladder cancer tissues and tumor-adjacent normal tissues were compared for LOH on chromosome region 20q11-13 with nine microsatellite markers. LOH at least one locus in the 20q11-13 region was observed in 17 of the 33 patients (51.5%) (Figure 2). The representative examples of cases with loss and retention of heterozygosity and homozygosity in the 20q11-13 region are shown in Figures 3a and 3b.
In Table 4, it was shown the frequency of LOH for each primer in all informative cases. For D20S481, LOH was detected for 6 in 23 informative cases (26.1%). 1 LOH was detected among the 20 informative cases for D20S465 (5%). 5 LOH in 26 informative cases (19.2%) for D20S118; 3 LOH in 12 informative cases (25%) for D20S891; 3 LOH in 18 informative cases (16.7%) for D20S171; 2 LOH in 19 informative cases (11.1%) for D20S174; 2 LOH in 11 informative cases (18.1%) for D20S468 and 6 LOH in 20 informative cases (30%) for D20S872 were detected. There was no LOH in 11 informative cases for D20S443. Consequently, the highest LOH frequency was detected in D20S872 (30%), D20S481 (26.1%), and D20S891 (25%), respectively (Table 4). The lowest LOH frequency was detected in D20S465 (5%). There was no LOH detection in D20S443.
Association between LOH on 20q11-13 and tumor stage and grade
LOH on the 20q11-13 region was compared with tumor stages and grades. The highest LOH frequency was shown in stage 2 (T2) and grade 3 (G3) depending on tumor grades and stages. The results are shown in Tables 5 and 6. But when we analyzed the results statically (p>0.05), there was no association between LOH and tumor stage and grade (Table 7). We cannot obtain any statistical data for D20S443 due to the absence of LOH.
Table 4. Frequency of LOH for each primer in all informative cases.
| Loci | IC (n) | LOH in IC (n) | % |
| D20S481 | 23 | 6 | 26.1 |
| D20S465 | 20 | 1 | 5 |
| D20S118 | 26 | 5 | 19.2 |
| D20S174 | 19 | 2 | 11.1 |
| D20S171 | 18 | 3 | 16.7 |
| D20S891 | 12 | 3 | 25 |
| D20S468 | 11 | 2 | 18.1 |
| D20S872 | 20 | 6 | 30 |
| D20S443 | 11 | 0 | 0 |
IC: informative cases for each primer, LOH: Loss of heterozygosity.

Figure 2. Illustration for LOH at least one marker in the 20q11-13 region.
Table 5. Association between LOH and tumor stages.
| Tumor stages | Number of cases | LOH at least one locus | % |
| T0 | 1 | 0 | 0 |
| Ta | 13 | 7 | 53.9 |
| T1 | 4 | 1 | 25 |
| T2 | 14 | 8 | 57.1 |
| T3 | 1 | 1 | 100 |
LOH: Loss of heterozygosity.

Figure 3. Illustration of represantive examples of cases with loss and retention of heterozygosity (a) and homozygosity (b) on 20q11-13 region (N: normal DNA, T: tumor DNA, allelic loss shown by arrows. Case 26 for D20S468 and 8 for D20S872 demonstrate homozygosity).
DISCUSSION
Inactivation of a tumor suppressor gene is closely related to any human carcinoma. Allelic losses on a chromosomal region detecting tumor progression are started or developed toward the invasive stages. Loss of heterozygosity analysis is one of the common methods that is used to determine inactive tumor suppressor genes. It is reported increasingly day by day for all carcinomas. This analysis is a sensitive method for monitoring deleted regions on chromosomes (26).
In this study, 9 polymorphic microsatellite markers were selected in a large region on chromosome 20q for LOH analysis at 33 bladder tumors. LOH ranging from 30% to 5% was detected on these markers.
Table 6. Association between LOH and tumor grades.
| Tumor grades | Number of cases | LOH at least one locus | % |
| G1 | 2 | 1 | 50 |
| G2 | 8 | 4 | 50 |
| G3 | 23 | 12 | 52.2 |
LOH: Loss of heterozygosity.
In this study, 9 polymorphic microsatellite markers were selected in a large region on chromosome 20q for LOH analysis at 33 bladder tumors. LOH ranging from 30% to 5% was detected on these markers. In this study, the D20S118 (%19,2), D20S468 (%18,2), D20S171 (%16,7), D20S174 (%11,1) and D20S465 (%5) markers had lower LOH frequencies than the other three markers (D20S872, D20S481, and D20S891). And LOH was not detected on the D20S443 marker (0%). Similarly, it was detected that LOH on 20q11.22 in gastric adenocarcinoma (27). Pei et al. (28) detected LOH on 20q in chronic lymphocytic leukemia. Peng et al. (19) detected high-frequency LOH on the 20q11.1-q13.1 chromosomal region in colorectal cancer. Another study which was reported by Huang et al. (20) supported that retinoblastoma progression was associated with LOH on the 20q11-13 chromosomal region. Also, LOH on the 20q12 region with a ratio of 61.1% was detected in chronic lymphocytic leukemia by Lee et al. (21).
A high frequency of LOH was detected on the D20S872 (30%) locus which is located on the 20q11.21 chromosomal region. This primer is directly related to the XKR7 (XK-related protein 7) gene which is expressed as a transmembrane protein. This protein ensures sodium-dependent transport of neutral amino acids and oligopeptides and is one of the XK family members and the lack of this protein is caused by McLeod syndrome (29). At the same time, this is the first study about this chromosomal region and gene in bladder cancer. The high frequency of LOH observed in this region indicates that the XKR7 gene is a tumor suppressor gene candidate. For this reason, it is recommended to investigate the gene and protein expression levels of XKR7 in different cancer types. Further, some important genes are located near this marker, like BCL2L1, PDRG1, and KIF3B. BCL2L1 (B-cell lymphoma 2-like 1) is an important apoptosis-regulating gene that codes for anti-apoptotic protein BCL-xL and it is commonly amplified among cancers (30). PDRG1 (p53 and DNA damage-regulated gene1) is upregulated by UV radiation but downregulated by tumor suppressor p53 and it is known as an oncogenic protein (31,32). Despite being one of the genes in the region where the loss of heterozygosity is common, PDRG1 also shows oncogenic character among different cancer types in recent studies (33-35). Similarly, KIF3B (kinesin family member 3B) which aids in chromosome movement during mitosis and meiosis and consists of a family of molecular motors and shows function in vesicle transport and membrane expansion during mitosis through targeting of other molecules, shows oncogenic features in cancer types (36-39). Briefly, LOH in the 20q11.21 region can be attributed to tumorigenesis because of the XKR7 gene function but adjacent gene points like BCL2L1, PDRG1, and KIF3B are oncogenic genes and they have not shown tumor suppressor features. At this point, more detailed analyses and a larger number of patients may be required.
Table 7. Relationship between nine microsatellite markers on 20q11–13 and their clinicopathological characteristics.
| Case | Features | LOH+ | LOH- | p | OR (95%CI) |
| D20S401 | Sample size | n=6 | n=27 | ||
| Age* | 69.0±5.62 | 63.44±12.11 | 0.295 | 1.056 (0.953-1.171) | |
| Gender | |||||
| Female | 0 (0) | 1 (3.7) | 0.818 | ||
| Male | 6 (100) | 26 (96.3) | |||
| Grade | |||||
| G1 | 1 (16.7) | 1 (3.7) | 0.305 | 4.750 (0.243-92.97) | |
| G2 | 1 (16.7) | 7 (25.9) | 0.747 | 0.679 (0.064-7.161) | |
| G3 | 4 (66.7) | 19 (70.4) | – | 1 (Ref) | |
| Stage | |||||
| Ta | 2 (33.3) | 11 (40.7) | 1 | 293722664.2 (0) | |
| T0 | 0 (0) | 1 (3.7) | 1 | 1 | |
| T1 | 0 (0) | 4 (14.8) | 1 | 1 | |
| T2 | 4 (66.7) | 10 (37) | 1 | 646189861.3 (0) | |
| T3 | 0 (0) | 1 (3.7) | – | 1 (Ref) | |
| Type | |||||
| TTC | 5 (83.3) | 25 (92.6) | 0.487 | 0.400 (0.030-5.307) | |
| Adenocarcinoma | 1 (16.7) | 2 (7.4) | – | 1 (Ref) | |
| D20S465 | Sample size | n=1 | n=32 | ||
| Age* | 35 | 64.9±11.3 | 0.258 | 0.92 (0.795-1.063) | |
| Gender | |||||
| Female | 0 (0) | 1 (3.1) | 0.97 | ||
| Male | 1 (100) | 31 (96.9) | |||
| Grade | |||||
| G1 | 0 | 2 (6.3) | 0.999 | 0 | |
| G2 | 0 | 8 (25) | 0.999 | 0 | |
| G3 | 1 (100) | 22(68.8) | – | 1 (Ref) | |
| Stage | |||||
| Ta | 1 (100) | 12 (37.5) | 1 | 134622899.5 (0) | |
| T0 | 0 | 1 (3.1) | 1 | 1 | |
| T1 | 0 | 4 (12.5) | 1 | 1 | |
| T2 | 0 | 14 (43.8) | 1 | 1 | |
| T3 | 0 | 1(3.1) | – | 1 (Ref) | |
| Type | |||||
| TTC | 1 (100) | 29 (90.6) | 0.999 | 55706028.9 (0) | |
| Adenocarcinoma | 0 (0) | 3 (9.4) | – | 1 (Ref) |
Table 7. (continue)
| D20S118 | Sample size | n=5 | n=28 | ||
| Age* | 60,2±14,77 | 64,38±10,39 | 0,376 | 0,966(0,895-1,043) | |
| Gender | |||||
| Female | 1 (20) | 0 (0) | 0,152 | ||
| Male | 4 (80) | 28 (100) | |||
| Grade | |||||
| G1 | 0 | 2 (7,1) | 0,999 | 0 | |
| G2 | 1 (20) | 7 (25) | 0,747 | 0,679(0,064-7,161) | |
| G3 | 4 (80) | 19 (67,9) | – | 1 (Ref) | |
| Stage | |||||
| Ta | 1 (20) | 12 (42,9) | 1 | 134623060,0 (0) | |
| T0 | 0 (0) | 1 (3,6) | 1 | 1 | |
| T1 | 0 (0) | 4 (14.3) | 1 | 1 | |
| T2 | 4 (80) | 10 (35.7) | 1 | 646190688.4 (0) | |
| T3 | 0 (0) | 1 (3.6) | 1 (Ref) | ||
| Type | |||||
| TTC | 5 (100) | 25 (89.3) | 0.999 | 323094922.2 (0) | |
| Adenocarcinoma | 0 (0) | 3 (10.7) | – | 1 (Ref) | |
| D20S174 | Sample size | n=2 | n=31 | ||
| Age* | 70.5±2.04 | 64.06±11.66 | 0.449 | 1.075(0.892-1.296) | |
| Gender | |||||
| Female | 0 | 1 (3.2) | 0.939 | ||
| Male | 2 (100) | 30 (96.8) | |||
| Grade | |||||
| G1 | 0 | 2 (6.5) | 0.999 | 0 | |
| G2 | 1 (50) | 7 (22.6) | 0.439 | 3.143(0.173- 57.082) | |
| G3 | 1 (50) | 22 (70.9) | – | 1 Ref | |
| Stage | |||||
| Ta | 1 (50) | 12 (38.7) | 1 | 134622917.2 (0) | |
| T0 | 0 (0) | 1 (3.2) | 1 | 1 | |
| T1 | 0 (0) | 4 (12.9) | 1 | 1 | |
| T2 | 1 (50) | 13 (41.9) | 1 | 124267308.2 (0) | |
| T3 | 0 (0) | 1 (3.2) | – | 1 (Ref) | |
| Type | |||||
| TTC | 2 (100) | 28 (90.3) | 0.999 | 115391061.5 (0) | |
| Adenocarcinoma | 0 (0) | 3 (97.7) | – | 1 (Ref) | |
| Features | LOH+ | LOH- | p | OR (95%CI) |
Table 7. (continue)
| D20S171 | Sample size | n=3 | n=30 | ||
| Age* | 69.66±5.4 | 63.93±11.73 | 0.417 | 1.062 | |
| (0.918-1.228) | |||||
| Gender | |||||
| Female | 0 (0) | 1 (3.3) | 0.909 | ||
| Male | 3 (100) | 29 (96.7) | |||
| Grade | |||||
| G1 | 0 | 2 (6.7) | 0.999 | 0 | |
| G2 | 1 (33.3) | 7 (23.3) | 0.755 | 1.5 (0.117-19.178) | |
| G3 | 2 (66.7) | 21 (70) | – | 1 (Ref) | |
| Stage | |||||
| Ta | 1 (33.3) | 12 (40) | 1 | 134622830.8 (0) | |
| T0 | 0 (0) | 1 (3.3) | 1 | 1 | |
| T1 | 1 (33.3) | 3 (10) | 1 | 538491323.2 (0) | |
| T2 | 1 (33.3) | 13 (43.3) | 1 | 124267228.4 (0) | |
| T3 | 0 (0) | 1 (3.3) | – | ||
| Type | |||||
| TTC | 3 (100) | 27 (90) | 0.999 | 179497202.9 (0) | |
| Adenocarcinoma | 0 (0) | 3 (10) | – | 1 (Ref) | |
| D20S891 | Sample size | n=3 | n=30 | ||
| Age* | 66.33±4.64 | 64.26±11.8 | 0.766 | 1.017(0.908-1.140) | |
| Gender | |||||
| Female | 0 (0) | 1 (3.3) | 0.909 | ||
| Male | 3 (100) | 29 (96.7) | |||
| Grade | |||||
| G1 | 0 | 2 (6.7) | 0.999 | 0 | |
| G2 | 1 (33.3) | 7 (23.3) | 0.755 | 1.5 (0.117-19.178) | |
| G3 | 2 (66.7) | 21 (70) | – | 1 (Ref) | |
| Stage | |||||
| Ta | 1 (33.3) | 12 (40) | 1 | 0 | |
| T0 | 0 (0) | 1 (3.3) | 0.999 | 0 | |
| T1 | 0 (0) | 4 (13.3) | 0.999 | 0 | |
| T2 | 1 (33.3) | 13 (43.3) | 1 | 0 | |
| T3 | 1 (33.3) | 0 (0) | – | 1 (Ref) | |
| Type | |||||
| TTC | 3 (100) | 27 (90) | 0.999 | 179497199.1 (0) | |
| Adenocarcinoma | 0 (0) | 3 (10) | – | 1 (Ref) |
Table 7. (continue)
| D20S468 | Sample size | n=2 | n=31 | ||
| Age* | 73.5±2.5 | 63.87±11.52 | 0.251 | 1.156 (0.902-1.482) | |
| Gender | |||||
| Female | 0 (0) | 1 (3.2) | 0.939 | ||
| Male | 2 (100) | 30 (96.8) | |||
| Grade | |||||
| G1 | 0 (0) | 2 (6.5) | 0.999 | 0 | |
| G2 | 0 (0) | 8 (25.8) | 0.999 | 0 | |
| G3 | 2 (100) | 21 (67.7) | – | 1 (Ref) | |
| Stage | |||||
| Ta | 0 (0) | 13 (41.9) | 1 | 1 | |
| T0 | 0 (0) | 1 (3.2) | 1 | 1 | |
| T1 | 0 (0) | 4 (12.9) | 1 | 1 | |
| T2 | 2 (100) | 12 (38.7) | 1 | 269245990.8 (0) | |
| T3 | 0 (0) | 1 (3.2) | – | 1 (Ref) | |
| Type | |||||
| TTC | 2 (100) | 28 (90.3) | 0.999 | 115391059.2 (0) | |
| Adenocarcinoma | 0 (0) | 3 (9.7) | – | 1 (Ref) | |
| D20S872 | Sample size | n=6 | n=27 | ||
| Age* | 66.66±7.73 | 63.0±11.91 | 0.603 | 1.023(0.939-1.115) | |
| Gender | |||||
| Female | 0 (0) | 1 (3.7) | 0.818 | ||
| Male | 6 (100) | 26 (96.3) | |||
| Grade | |||||
| G1 | 0 (0) | 2 (7.4) | 0.999 | 0 | |
| G2 | 1 (16.7) | 7 (25.9) | 0.574 | 0.514 (0.051-5.221) | |
| G3 | 5 (83.3) | 18 (66.7) | 1 (Ref) | ||
| Stage | |||||
| Ta | 2 (33.3) | 11 (40.7) | 1 | 293722316.4 (0) | |
| T0 | 0 (0) | 1 (3.7) | 1 | 1 | |
| T1 | 1 (16.7) | 3 (11.1) | 1 | 538490913.4 (0) | |
| T2 | 3 (50) | 11 (40.7) | 1 | 440583474.6 (0) | |
| T3 | 0 (0) | 1 (3.7) | – | 1 (Ref) | |
| Type | |||||
| TTC | 5 (83.3) | 25 (92.6) | 0.487 | 0.4(0.030-5.307) | |
| Adenocarcinoma | 1 (16.7) | 2 (7.4) | – | 1 (Ref) |
* Mean±standard deviation. CI: Confidence interval, LOH: Loss of heterozygosity, OR: Odds ratio, +: presence, -: absence.
A high frequency of LOH was detected on the D20S872 (30%) locus which is located on the 20q11.21 chromosomal region. This primer is directly related to the XKR7 (XK-related protein 7) gene which is expressed as a transmembrane protein. This protein ensures sodium-dependent transport of neutral amino acids and oligopeptides and is one of the XK family members and the lack of this protein is caused by McLeod syndrome (29). At the same time, this is the first study about this chromosomal region and gene in bladder cancer. The high frequency of LOH observed in this region indicates that the XKR7 gene is a tumor suppressor gene candidate. For this reason, it is recommended to investigate the gene and protein expression levels of XKR7 in different cancer types. Further, some important genes are located near this marker, like BCL2L1, PDRG1, and KIF3B. BCL2L1 (B-cell lymphoma 2-like 1) is an important apoptosis-regulating gene that codes for anti-apoptotic protein BCL-xL and it is commonly amplified among cancers (30). PDRG1 (p53 and DNA damage-regulated gene1) is upregulated by UV radiation but downregulated by tumor suppressor p53 and it is known as an oncogenic protein (31,32). Despite being one of the genes in the region where the loss of heterozygosity is common, PDRG1 also shows oncogenic character among different cancer types in recent studies (33-35). Similarly, KIF3B (kinesin family member 3B) which aids in chromosome movement during mitosis and meiosis and consists of a family of molecular motors and shows function in vesicle transport and membrane expansion during mitosis through targeting of other molecules, shows oncogenic features in cancer types (36-39). Briefly, LOH in the 20q11.21 region can be attributed to tumorigenesis because of the XKR7 gene function but adjacent gene points like BCL2L1, PDRG1, and KIF3B are oncogenic genes and they have not shown tumor suppressor features. At this point, more detailed analyses and a larger number of patients may be required.
Another marker that showed a high frequency of LOH was D20S481, a marker for the NIDDM3 (noninsulin-dependent diabetic mellitus) gene. Its frequency was 26.1%. Another gene in this region, 20q12, is the nuclear receptor coactivator 3 (NCOA3; also known as SRC3 or NCOA3) gene. This gene produces a nuclear receptor coactivator protein called NCOA3 that interacts with nuclear hormone receptors to improve their capacity as transcriptional activators (40). NCOA3 also has an oncogenic role in a variety of tumor types (41).
D20S891 is the third primer which shows the highest frequency of LOH (25%). This marker which is a predictor of the ZMYND8 (zinc finger, MYND-type containing 8) gene, also known as RACK7, is located in the 20q13.12 region. This gene expresses kinds of receptors that are activated C-kinase protein (RACK) (42). It has been reported that ZMYND8 can have a tumor suppressor role in cancers (43).
Our results showed that LOH on 20q11-13 was detected in 51% (17/33) of bladder tumors and especially 52.2% (12/23) of invasive G3 and 57.1% (8/14) T2 tumors. There was no statistical association between LOH frequencies on each primer and tumor stages and grades (p>0,05). This may be related to the small number of patients. Knobloch et al. (44) who analyzed bladder cancer patient’s serum and urine DNAs with fluorescent microsatellite markers, reported that there was no association between tumor pathogenesis and LOH on 5q, 8p, 9p, 9q, 13q, 14q, 17p, 17q and 20q chromosomal regions. Similarly, some other reports have supported this lack of association (6, 7, 15, 45). On the contrary, it has been reported in some studies that there was a significant correlation between LOH and tumor grades and stages (11, 10, 46, 47).
In the literature, genomic alteration studies in bladder cancer appear in the form of gains and amplifications of the 20q region. In this study, loss of heterozygosity in bladder cancer of the 20q11-13 region was investigated for the first time. In addition, the presence of LOH in at least 1 locus in 17 of 33 patients indicates that this region may include candidate tumor suppressor genes as well as oncogenic genes. The development of molecular analysis in the early diagnosis of bladder cancer has been tried to contribute to this study. We recommend further molecular analyses with larger patient groups to detect candidate tumor suppressor genes in this region. Moreover, for the identification of new candidate tumor suppressor genes for bladder cancer, further genome-wide LOH scanning may provide much more genetic information.
Conflicts of Interest
The authors declared no potential conflicts of interest concerning the research, authorship, and/or publication of this article.
Financial disclosure
This study was funded by Gaziantep University Scientific Research Projects Management Unit, project FEF.12.03. The funding source did not affect the study design, data collection, analysis and interpretation, writing, and submission of the manuscript.
REFERENCES
Stoehr R, Wissmann C, Suzuki H, et al. Deletions of chromosome 8p and loss of sFRP1 expression are progression markers of papillary bladder cancer. Laboratory Investigation. 2004;84(4):465-478. doi: 10.1038/labinvest.3700068.
Hwang MS, Mog BJ, Douglass J, et al. Targeting loss of heterozygosity for cancer-specific immunotherapy. Proc Natl Acad Sci. 2021;23;118(12),1-10. doi: 10.1073/pnas.2022410118.
Park S, Supek F, Lehner B. Systematic discovery of germline cancer predisposition genes through the identification of somatic second hits. Nat Commun. 2018;4;9(1):2601. doi: 10.1038/s41467-018-04900-7.
Ozaslan M, Aytekin T. Loss of heterozygosity in colorectal cancer. African Journal of Biotechnology. 2009;8(25), 7308-7312.
NCI, 2022. Cancer Stat Facts: Bladder Cancer. https://seer.cancer.gov/statfacts/html/urinb.html. Accessed 18 June 2023.
WHO calls for the prevention of cancer through healthy workplaces. https://www.who.int/news/item/27-04-2007-who-calls-for-prevention-of-cancer-through-healthy-workplaces. Accessed: 09 July 2023
Natrajan R, Louhelainen J, Williams S, et al. High-resolution deletion mapping of 15q13.2-q21.1 in transitional cell carcinoma of the bladder. Cancer Research. 2003;15;63(22):7657-62.
Higashi S, Habuchi T, Takahashi T, et al. Allelic Imbalances on Chromosome 20 in Human Transitional Cell Carcinoma. Jpn. J. Cancer Res. 2000;(91), 499–503.
Cappellen D, Diez de Medina S, Chopin D, et al. Frequent loss of heterozygosity on chromosome 10q in muscle-invasive transitional cell carcinomas of the bladder. Oncogene. 1997;14, 3059-3066.
Sengelova L, Christensen M, Maasec H, et al. Loss of heterozygosity at 1p, 8p, 10p, 13q, and 17p in advanced urothelial cancer and lack of relation to chemotherapy response and outcome. Cancer Genetics and Cytogenetics 2000;123(2):109-13. doi: 10.1016/s0165-4608(00)00308-3.
Uchida A, Tachibana M, Miyakawa A, et al. Microsatellite analysis in multiple chromosomal regions as a prognostic indicator of primary bladder cancer. Urol Res. 2000;28, 297-303. doi: 10.1007/s002400000137.
Wada T, Louhelainen J, Hemminki K, et al. Bladder cancer: allelic deletions at and around the retinoblastoma tumor suppressor gene about stage and grade. Clin Cancer Res. 2000;6, 610-615.
Yoon DS, Li L, Zhang RD, et al. Genetic mapping and DNA sequence-based analysis of deleted regions on chromosome 16 involved in the progression of bladder cancer from occult preneoplastic conditions to invasive disease. Oncogene. 2001;16;20(36):5005-5014. doi: 10.1038/sj.onc.1204612.
Jones TD, Carr MD, Eble JN, et al. Clonal Origin of Lymph Node Metastases in Bladder Carcinoma. Cancer. 2005;1;104(9):1901-1910. doi: 10.1002/cncr.21466.
Cai T, Mondaini N, Tiscione D, et al. Loss of heterozygosis on chromosome 18q21-23 and muscle-invasive bladder cancer natural history. Oncol Lett. 2015;10(4):2569-2573.
Beothe T, Nagy A, Farkas L, et al. P53 mutation and LOH at chromosome 9 in urothelial carcinoma. Anticancer Res. 2012;32(2):523-527 doi: .
Abdel-Rahman O. Bladder cancer mortality after a diagnosis of nonmuscle-invasive bladder carcinoma. Future Oncol. 2019;15(19):2267-2275.
Huiping C, Sigurgeirsdottir JR, Jonasson JG, et al. Chromosome alterations and E-cadherin gene mutations in human lobular breast cancer. Br J Cancer. 1999;81(7):1103–1110. doi: 10.1038/sj.bjc.6690815.
18- Lindblad-Toh K, Tanenbaum DM, Daly MJ, et al. Loss-of-heterozygosity analysis of small-cell lung carcinomas using single-nucleotide polymorphism arrays. Nature Biotechnology. 2000;18(9):1001-1005. doi: 10.1038/79269.
Peng Z, Zhou C, Zhang F, et al. Loss of heterozygosity of chromosome 20 in sporadic colorectal cancer. Chinese medical journal. 2002;115: 1529-1532.
Huang Q, Choy KW, Cheung KF, et al. Genetic alterations on Chromosome 19, 20, 21, 22, and X were detected by loss of heterozygosity analysis in retinoblastoma. Molecular Vision 2003;(9): 502-507.
Lee JN, Giles F, Huh YO, et al. Molecular differences between small and large cells in patients with chronic lymphocytic leukemia. Eur J Haematol. 2003;71(4):235-242. doi: 10.1034/j.1600-0609.2003.00089.x.
Yang SH, Seo MY, Jeong HJ, et al. Gene Copy Number Change Events at Chromosome 20 and Their Association with Recurrence in Gastric Cancer Patients. Clin Cancer Res. 2005;15;11(2 Pt 1):612-620.
Huh H, Mun YC, Seong CM, et al. Single nucleotide polymorphism array-based karyotyping shows sequential genomic changes from monosomy to copy-neutral loss of heterozygosity of chromosome 7 and 20q deletion within a balanced translocation t(14;20) in AML. Cancer Genetics. 2011;204:682-686.
Guo Z, Linn JF, Wu G, et al. CDC91L1 (PIG-U) is a newly discovered oncogene in human bladder cancer. Nature Medicine. 2004;10, 374-381.
Benbouza H, Jacquemin JM, Baudoin JP, et al. Optimization of a reliable, fast, cheap, and sensitive silver staining method to detect SSR markers in polyacrylamide gels. Biotechnol. Agron. Soc. Environ. 2006;10(2):77 – 81 doi:
Odell EW. Aneuploidy and loss of heterozygosity as risk markers for malignant transformation in oral mucosa. Oral Dis. 2021;27(8):1993-2007. doi: 10.1111/odi.13797.
Seabra AD, Araújo TM, Mello Junior FA, et al. High-density array comparative genomic hybridization detects novel copy number alterations in gastric adenocarcinoma. Anticancer Res. 2014;34(11):6405-6415.
Pei J, Robu V, Feder M, et al. Copy neutral loss of heterozygosity in 20q in chronic lymphocytic leukemia/small lymphocytic lymphoma. Cancer Genet. 2014;207(3):98-102. doi: 10.1016/j.cancergen.2014.02.005.
Zhu X, Cho ES, Sha Q, et al. Giant Axon Formation in Mice Lacking Kell, XK, or Kell and XK: Animal Models of McLeod Neuroacanthocytosis Syndrome. Am J Pathol. 2014;184(3):800-807. doi: 10.1016/j.ajpath.2013.11.013.
Guo T, Gu C, Li B, et al. Dual inhibition of FGFR4 and BCL-xL inhibits multi-resistant ovarian cancer with BCL2L1 gain. Aging (Albany NY). 2021;5;13(15):19750-19759.
Luo X, Huang Y, Sheikh MS. Cloning and characterization of a novel gene PDRG that is differentially regulated by p53 and ultraviolet radiation. Oncogene. 2003; 16;22(46):7247-7257. doi: 10.1038/sj.onc.1207010.
Pajares MÁ. PDRG1 at the interface between intermediary metabolism and oncogenesis. World J Biol Chem. 2007;26;8(4):175-186. doi: 10.4331/wjbc.v8.i4.175.
Xu Y, Liu J, Jiang T, et al. PDRG1 predicts a poor prognosis and facilitates the proliferation and metastasis of colorectal cancer. Exp Cell Res. 2021;15;409(2):112924. doi: 10.1016/j.yexcr.2021.112924.
Zhang YJ, Li JQ, Li HZ, et al. PDRG1 gene silencing contributes to inhibiting the growth and inducing apoptosis of gastric cancer cells. Pathol Res Pract. 2019;215(10):152567. doi: 10.1016/j.prp.2019.152567.
Tao Z, Zhang Y, Zhu S, et al. Knockdown of PDRG1 Could Inhibit the Wnt Signaling Pathway in Esophageal Cancer Cells. Ann Clin Lab Sci. 2019;49(6):794-803.
Wang C, Zhang R, Wang X, et al. Silencing of KIF3B Suppresses Breast Cancer Progression by Regulating EMT and Wnt/β-Catenin Signaling. Front Oncol. 2021;19;10:597464. doi: 10.3389/fonc.2020.597464.
Li TF, Zeng HJ, Shan Z, et al. Overexpression of kinesin superfamily members as prognostic biomarkers of breast cancer. Cancer Cell Int. 2020;15;20:123. doi: 10.1186/s12935-020-01191-1.
Liu ZH, Dong SX, Jia JH, et al. KIF3B Promotes the Proliferation of Pancreatic Cancer. Cancer Biother Radiopharm. 2019;34(6):355-361. doi: 10.1089/cbr.2018.2716.
Huang X, Liu F, Zhu C, et al. Suppression of KIF3B Expression Inhibits Human Hepatocellular Carcinoma Proliferation. Dig Dis Sci. 2014;59(4):795-806. doi: 10.1007/s10620-013-2969-2.
Zhang Y, Wang JH, Liu B, et al. Steroid receptor coactivator-3 promotes bladder cancer through upregulation of CXCR4. Asian Pac J Cancer Prev. 2013;14(6):3847-3850. doi: 10.7314/apjcp.2013.14.6.3847.
Li Y, Li L, Chen M, et al. MAD2L2 inhibits colorectal cancer growth by promoting NCOA3 ubiquitination and degradation. Mol Oncol. 2018;12(3):391-405. doi: 10.1002/1878-0261.12173.
Ansieau S, Sergeant A. BS69, and RACK7, a potential novel class of tumor suppressor genes. Pathol Biol. 2003;51(7):397-399 doi: .
Gong F, Miller KM. Double duty: ZMYND8 in the DNA damage response and cancer. Cell Cycle. 2018;17(4):414-420.
Knobloch R, Hegele A, Brandt H, et al. Serum DNA and urine DNA alterations of urinary transitional cell bladder carcinoma detected by fluorescent microsatellite analysis. Int J Cancer. 2001;94(1):67-72. doi: 10.1002/ijc.1434.
Kimura F, Florl AR, Seifert HH, et al. Destabilization of chromosome 9 in transitional cell carcinoma of the urinary bladder. Brit J of Cancer. 2001;85(12), 1887–1893. doi: 10.1054/bjoc.2001.2154.
Yang X, Shen P, Yao K, et al. High-frequency loss of heterozygosity in the region of the DBH locus in bladder cancer. Chin Med J (Engl). 2000;113(2):117-119.
